
In short: fire crews in England were called to free people stuck in a lift 13,769 times in the year to March 2026, about 38 times a day, the highest number since 2011/12. Station lifts in Great Britain had about seven faults each over the same year, and most were down to wear and tear. These lift statistics point the same way: regular maintenance, especially of the doors, is what stops most lift breakdowns and trap-ins before they happen.
This guide brings together the official lift statistics for the UK in one place, with our own charts, for building owners, managing agents and facilities teams. Every figure comes from a government or official source, named under each chart. We look after lifts across the UK, with most of our work in Essex, London and the South East, so we also explain what the figures mean for your building and what you can do about them.
In this guide
The 6 essential lift statistics at a glance
- 13,769 times fire crews in England freed people from lifts in the year to March 2026.
- 70 per 100,000 people in London, against 22 across England as a whole: London has by far the most lift rescues.
- 250 people were hurt or checked by crews at those lift rescues, and 21 of them needed hospital treatment.
- About 7 faults per lift a year on the 1,403 passenger lifts at Network Rail stations.
- 59% of those station lift faults were wear and tear, the kind of fault planned maintenance looks for.
- No official count of lifts in the UK exists. The best figure is the 300,000-plus lifts, escalators and other lifting products maintained by members of the lift industry’s trade body.
How often do people get stuck in a lift?
| Year to March | Lift releases attended by fire crews |
|---|---|
| 2009/10 | 20,059 |
| 2010/11 | 16,592 |
| 2011/12 | 14,176 |
| 2012/13 | 12,647 |
| 2013/14 | 11,194 |
| 2014/15 | 10,231 |
| 2015/16 | 10,418 |
| 2016/17 | 10,980 |
| 2017/18 | 11,260 |
| 2018/19 | 11,514 |
| 2019/20 | 11,710 |
| 2020/21 | 7,931 |
| 2021/22 | 11,087 |
| 2022/23 | 12,560 |
| 2023/24 | 12,546 |
| 2024/25 | 12,603 |
| 2025/26 | 13,769 |
Source: gov.uk fire statistics, table FIRE0901.
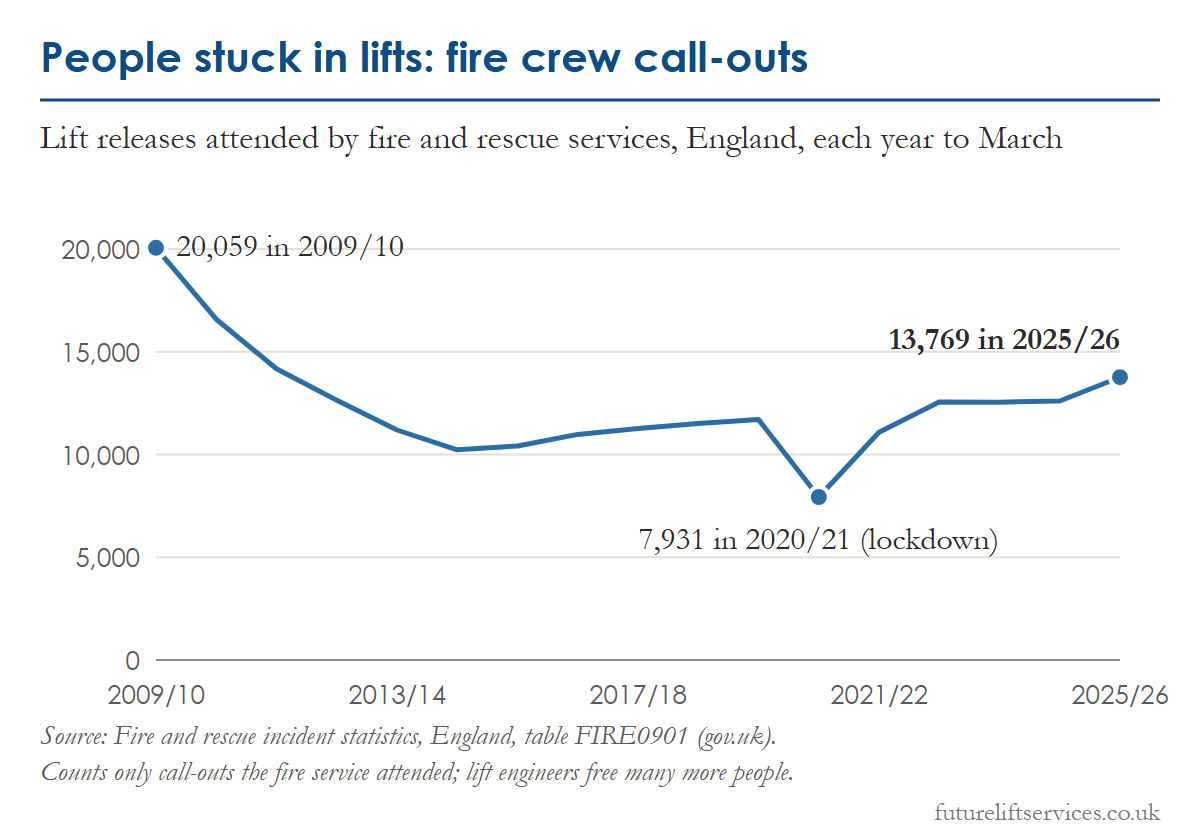
The best national measure of people stuck in a lift is the number of “lift releases” attended by fire and rescue services, published every year by the government.
- In the year to March 2026, fire crews in England attended 13,769 lift releases, about 38 a day.
- That is up from 12,603 the year before, and the highest figure since 2011/12.
- The newer quarterly figures, for the year to June 2026, show 14,122 lift releases, so the rise has continued.
- The number fell steadily from 20,059 in 2009/10 to around 10,000 a year by the mid-2010s, then started climbing again.
- The dip to 7,931 in 2020/21 is the lockdown year, when far fewer people were using lifts in offices, shops and stations.
These lift statistics count only the times the fire service attended. Many people stuck in a lift are freed by lift engineers without the fire service ever being called, so the real number of trap-ins is higher. Fire services also have different policies on when they attend, which affects the totals.
Why the number matters to building owners
Every one of those call-outs is a lift that stopped with someone inside it. For the person trapped, it is frightening; for the building, it means complaints, a lift out of use and often a repair bill.
Lift statistics by area: where people get stuck most often
| Fire service area | Lift releases per 100,000 residents |
|---|---|
| Greater London | 70.2 |
| East Sussex | 34.7 |
| West Sussex | 25.8 |
| Berkshire | 25.3 |
| Surrey | 18.8 |
| Kent | 17.4 |
| Essex | 17.2 |
| Greater Manchester | 16.8 |
| Hertfordshire | 14.2 |
| England average | 21.8 |
Source: our calculation from gov.uk fire statistics tables FIRE0901 and FIRE0903.
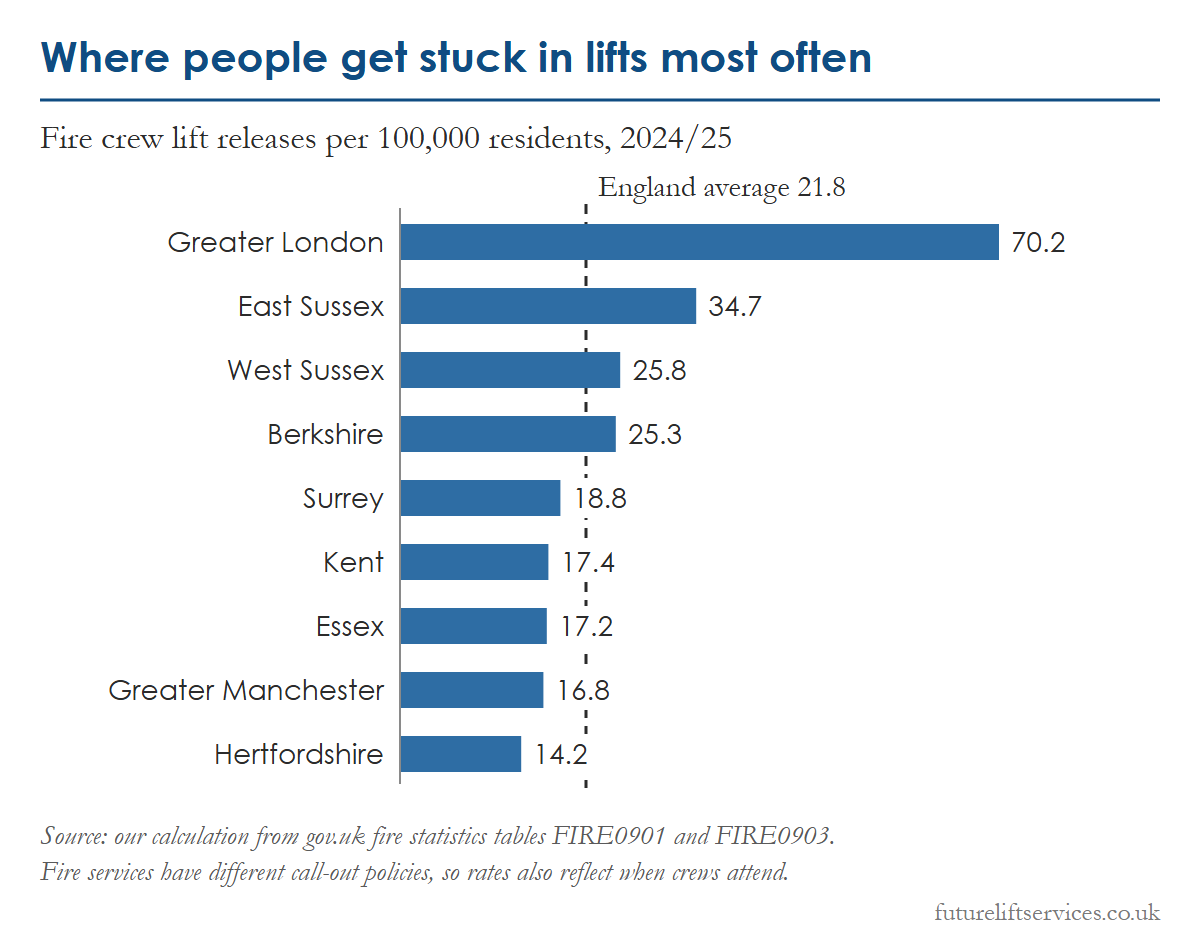
London stands out. In 2024/25 London fire crews freed people from lifts at a rate of 70.2 per 100,000 residents, more than three times the England average of 21.8. In 2025/26 London accounted for 7,100 of the 13,769 lift releases in England, just over half.
Closer to our Essex base, the rates in 2024/25 were 17.2 per 100,000 in Essex, 17.4 in Kent, 18.8 in Surrey and 14.2 in Hertfordshire. East and West Sussex and Berkshire were above the England average.
London’s own fire brigade records show that about three in four of the lift rescues it attended in 2025 were in blocks of flats. Many Londoners live in tall blocks of flats and depend on their lifts every day.
A word of caution on comparing areas. Fire services have different call-out policies, so a lower rate can mean crews attend less often, not that lifts break down less. Use these lift statistics as a guide to where trap-ins are common, not as a league table of safe and unsafe areas.
Are lifts safe? Injuries at lift rescues
| Year to March | Casualties | Needed hospital treatment |
|---|---|---|
| 2010/11 | 136 | 26 |
| 2011/12 | 168 | 19 |
| 2012/13 | 148 | 28 |
| 2013/14 | 144 | 22 |
| 2014/15 | 133 | 25 |
| 2015/16 | 167 | 26 |
| 2016/17 | 194 | 25 |
| 2017/18 | 210 | 43 |
| 2018/19 | 199 | 36 |
| 2019/20 | 170 | 30 |
| 2020/21 | 56 | 10 |
| 2021/22 | 109 | 24 |
| 2022/23 | 113 | 35 |
| 2023/24 | 170 | 26 |
| 2024/25 | 210 | 23 |
| 2025/26 | 250 | 21 |
Source: gov.uk fire statistics, table FIRE0904.
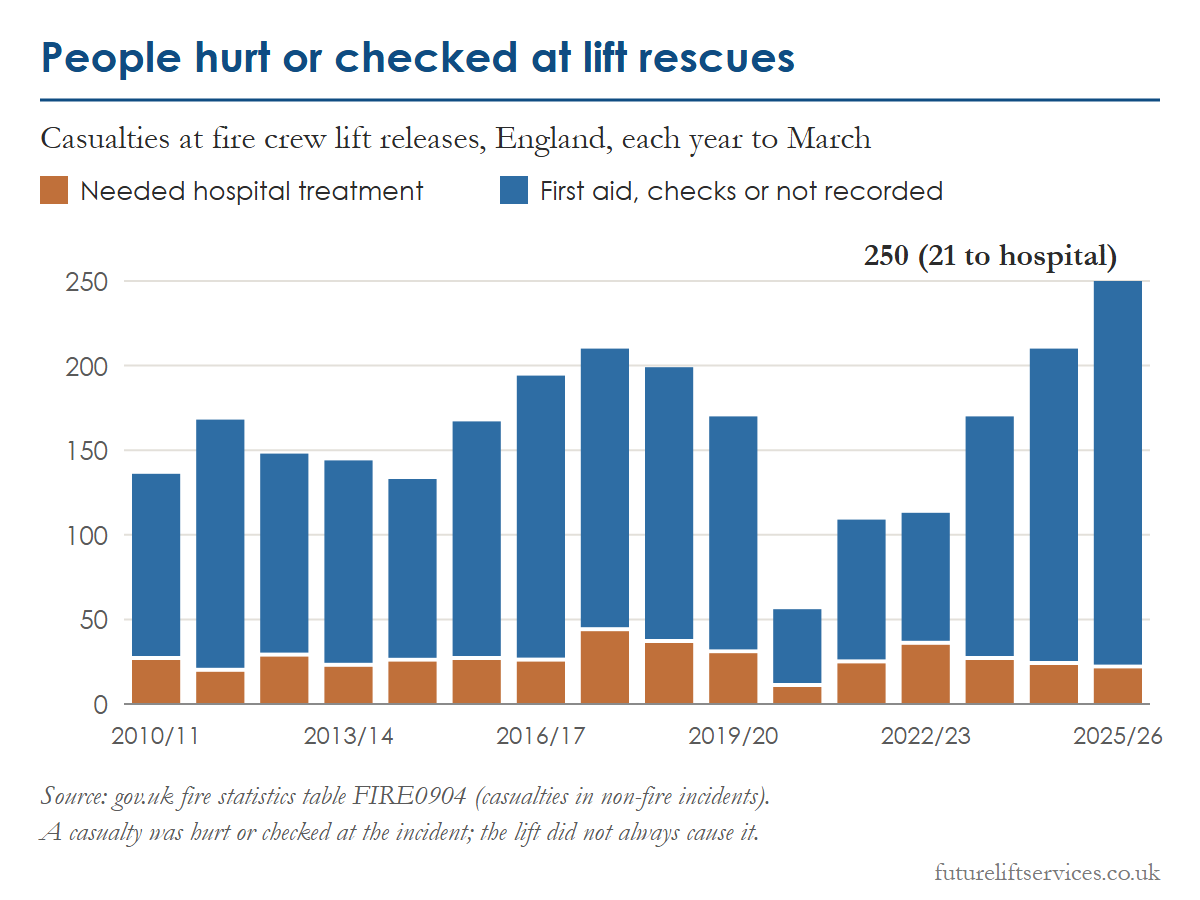
Lifts are among the safest ways to move around a building, and the official figures bear that out. Across the 13,769 lift releases in 2025/26:
- 250 people were recorded as casualties, about one for every 55 rescues.
- 21 needed hospital treatment.
- Most of the rest were given first aid or checked by the crew as a precaution.
A casualty here means someone who was hurt or checked at the incident. The figures don’t say the lift caused it: a person stuck in a lift for a long time can become unwell, faint or panic, especially in hot weather or if they have a health condition. That is one more reason to get trapped passengers out quickly.
There is no official UK figure for deaths caused by lifts, and you should be wary of any article that quotes one. Many of the scary numbers online come from the United States, where the rules and the lifts are different.
Lift breakdowns: how often do lifts break down?
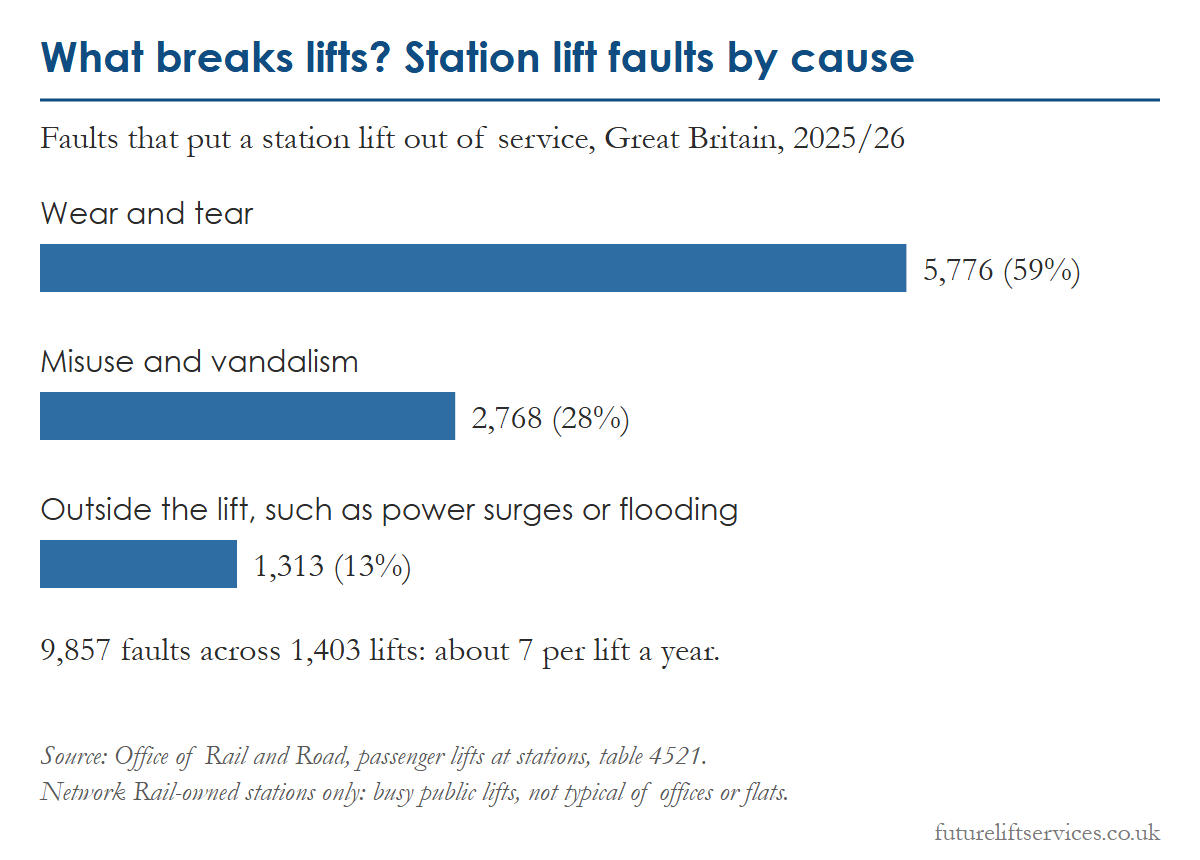
| Cause | Faults | Share |
|---|---|---|
| Wear and tear | 5,776 | 59% |
| Misuse and vandalism | 2,768 | 28% |
| Outside the lift, such as power surges or flooding | 1,313 | 13% |
| All causes | 9,857 | 100% |
9,857 faults across 1,403 lifts: about 7 per lift. Average repair 20.2 hours. Source: Office of Rail and Road, table 4521.
There is no national record of lift breakdowns in offices, flats or shops. The best published lift statistics on breakdowns come from the Office of Rail and Road, which tracks every passenger lift at Network Rail-owned stations.
In the year to March 2026, the 1,403 station lifts had 9,857 faults that took them out of service, about seven faults per lift in the year. The average repair took about 20 hours. The causes were:
- Wear and tear: 59%. Parts wearing out through normal use.
- Misuse and vandalism: 28%. Doors forced or held, buttons damaged, and similar.
- Outside the lift: 13%. Power surges, flooding and other causes that start outside the lift itself.
Station lifts are heavily used public lifts, open long hours and exposed to the weather, so they are not typical of a lift in an office or a block of flats. But the pattern holds for every lift: most lift breakdowns come from parts wearing out, and worn parts give warning signs that a trained engineer can spot at a service visit.
How long do people wait when they are stuck?
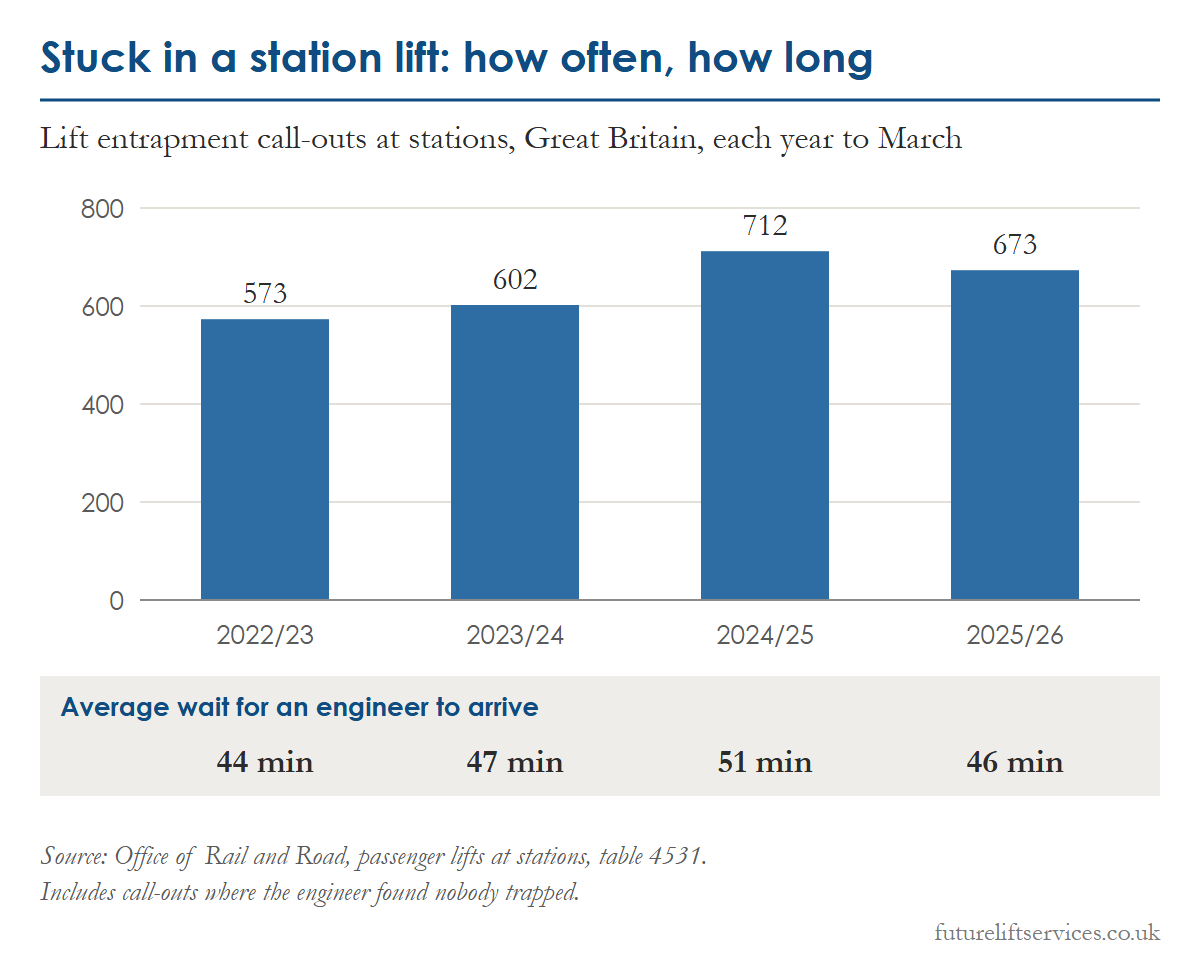
| Year to March | Entrapment call-outs | Average wait (minutes) | Over 75 minutes |
|---|---|---|---|
| 2022/23 | 573 | 44 | 67 |
| 2023/24 | 602 | 47 | 95 |
| 2024/25 | 712 | 51 | 125 |
| 2025/26 | 673 | 46 | 64 |
Source: Office of Rail and Road, table 4531.
The same rail figures show how long people wait to be freed. In 2025/26 there were 673 entrapment call-outs at station lifts, and the average wait for an engineer to arrive was 46 minutes. In 64 cases it took more than 75 minutes. Shorter waits depend on two things: an engineer based nearby, and a lift company that treats a trapped person as the top priority.
How many lifts are there in the UK?
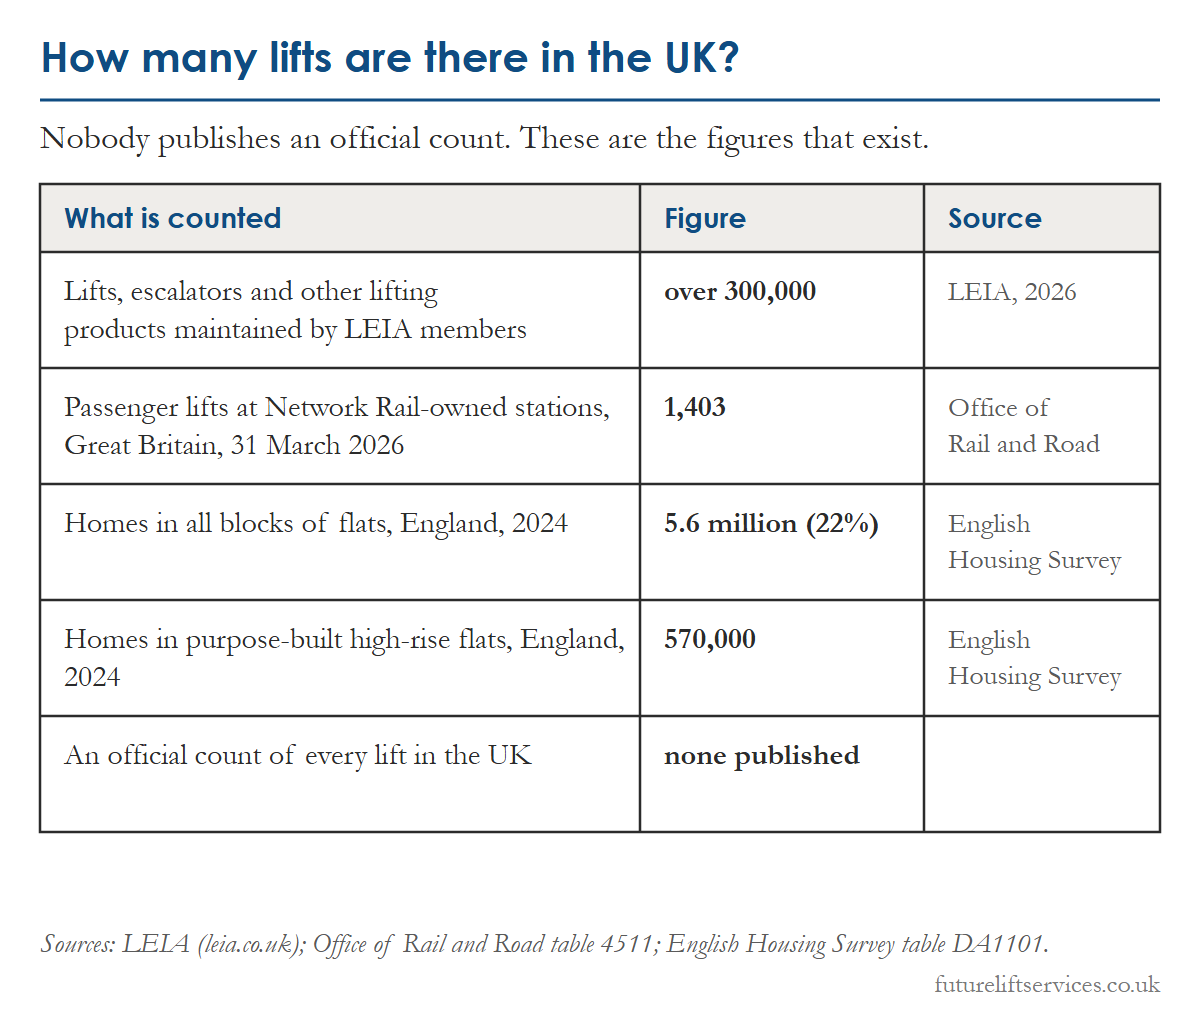
| What | Where | When | Figure | Source |
|---|---|---|---|---|
| Lifts, escalators and other lifting products maintained by LEIA members | UK | 2026 | over 300,000 | LEIA |
| Passenger lifts at Network Rail-owned stations | Great Britain | 31 March 2026 | 1,403 | Office of Rail and Road, table 4511 |
| Homes in all blocks of flats | England | 2024 | 5.6 million (22%) | English Housing Survey, table DA1101 |
| Homes in purpose-built high-rise flats | England | 2024 | 570,000 | English Housing Survey, table DA1101 |
| Official count of every lift in the UK | UK | 2026 | none published |
This is one of the most searched questions about lifts, and the honest answer is that nobody knows exactly. There is no official register of lifts in the UK.
The figures that do exist:
- Over 300,000 lifts, escalators and other lifting products are maintained by members of LEIA, the lift industry’s trade body. That is the closest thing to a national total, but it includes escalators, stairlifts and platforms, and leaves out equipment looked after by firms outside LEIA.
- 1,403 passenger lifts at Network Rail-owned stations in Great Britain, up from 1,263 in 2023 as more stations become step-free.
- 5.6 million homes in England (22%) are in blocks of flats, and 570,000 are in purpose-built high-rise flats. Not every block has a lift, but the residents of most taller blocks depend on one.
Industry estimates also suggest that a large share of UK lifts are more than 20 or 25 years old. We haven’t found a survey behind those estimates, so treat them with care.
What these lift statistics mean for your building

Put the figures together and the message is simple. People get stuck in a lift tens of thousands of times a year, and most lift breakdowns start with parts wearing out. Wear is exactly what regular maintenance is there to catch.
Door faults cause most trap-ins
On the lifts we look after, door faults are the biggest cause of people getting stuck in a lift. A lift will not move unless every landing door and the car door are closed and locked, so anything that stops a door closing or locking properly can stop the lift, sometimes between floors. Common culprits are:
- worn door rollers, shoes and tracks, so doors drag or stick,
- dirt, grit and rubbish in the door sills, so doors can’t close fully,
- door locks and their contacts knocked out of line by trolleys, prams or people holding the doors,
- worn door operators, the motors and linkages that open and close the doors,
- tired safety edges, which make doors reopen again and again.
Each of these builds up slowly, and each can be found and fixed at a service visit before anyone is stuck in a lift.
Warning signs of lift breakdowns
Most lift breakdowns give some warning first. Call your lift company if you notice:
- doors that are slow, noisy, stick or keep reopening,
- the lift stopping slightly above or below the floor,
- jolts or judders when it starts or stops,
- new noises from the shaft or machine room: grinding, squealing or knocking,
- buttons or floor indicators that don’t light or don’t respond,
- the lift going out of service and then coming back on its own.
Caught early, these are usually small adjustments or a single part. Left alone, they are where the next trap-in comes from.
How regular maintenance prevents trap-ins
A planned service is not a quick look. At each visit our engineers work to our own maintenance log, which includes:
- the doors: locks, contacts, rollers, tracks, door operators and safety edges, with the sills, tracks and headers cleaned,
- levelling: checking the lift stops level at every floor,
- starting, running and stopping: listening and watching for early signs of wear in the drive and brake,
- the alarm, emergency lighting and autodialler, so anyone who is trapped can call for help and isn’t left in the dark,
- ropes, guides and the pit, with guides lubricated and the pit cleaned,
- the control panel, looking for heat damage, loose connections and failing parts.
Worn parts are noted, explained to you and quoted for before they fail, so repairs can be planned for a quiet time instead of happening as an emergency.
How often should a lift be serviced?
We recommend servicing passenger lifts every two months and most other lifts twice a year, with more visits for lifts that work very hard. Servicing is separate from the independent thorough examination that LOLER requires for lifts used at work: at least every 6 months for lifts that carry people and every 12 months for goods-only lifts. Our LOLER guide explains how the two fit together.
Rules for lifts in high-rise flats
If you are responsible for a residential building at least 18 metres or seven storeys high, the Fire Safety (England) Regulations 2022 add two duties: check the firefighting and evacuation lifts every month, and tell the local fire and rescue service if one of them is out of action for more than 24 hours. Regular maintenance makes both easier, because faults are found and fixed before they turn into long outages. The Building Safety Act 2022 also brings extra duties for higher-risk buildings.
Our lift maintenance page explains what a contract with us covers, and our lift maintenance contract guide explains what to look for in any contract.
Questions to ask your lift company
The lift statistics above show what can go wrong. These questions show whether your lift company is working to stop it:
- How often do you service our lift, and does every visit include the doors?
- What happens if someone is stuck in a lift? How quickly do you send an engineer, and is a trapped person always the top priority?
- Who answers the phone at night and at weekends?
- Do you tell us about worn parts before they fail, with a quote, so we can plan repairs?
- Do you keep a record of every visit and repair that we can see?
- How do you work with our LOLER examiner and deal with the defects in the report?
If the answers are vague, it may be time for a second opinion.
Ways to cut trap-ins in your building
Alongside regular servicing, a few simple habits make a real difference:
- Report door problems straight away. Doors that bang, stick, reopen or need a push are the most common warning sign.
- Keep the sills clean. Grit and rubbish in the door tracks are a common cause of door faults, especially in busy entrances.
- Ask people not to hold or force the doors. A sign by the lift and a word with cleaners and contractors helps.
- Protect the lift during moves and building work. Trolleys and furniture are hard on doors; use protective covers and keep to the lift’s rated load.
- Check the alarm works. If someone is stuck in a lift, the alarm and the emergency phone line are their link to help.
- Don’t ignore small faults. A lift that stops slightly off level, judders or makes a new noise is telling you something.
What to do if someone is stuck in a lift
- Stay calm and reassure them. Lifts are designed to hold people safely while they wait, and there is plenty of air.
- Get them to press the alarm button if they haven’t already, and talk to them through the doors.
- Call your lift company. Contract customers should use the number in their contract or on the lift.
- Call 999 if anyone is unwell, injured or in danger.
- Never try to force the doors or pull someone out. Only a trained engineer or the fire service should release trapped passengers.
If someone is trapped in a lift we maintain, we send an engineer straight away and aim to be on site within an hour, any time of day or night. Our lift breakdown guide explains what happens next, and our lift repairs page covers the repairs that follow.
About these lift statistics
We built these charts from the latest official sources, read in October 2026:
- fire crew lift releases and casualties: the government’s fire statistics data tables (tables FIRE0901, FIRE0903 and FIRE0904), for England;
- station lift faults, entrapments and lift numbers: the Office of Rail and Road’s passenger lifts at stations statistics, for Great Britain;
- homes in blocks of flats: the English Housing Survey;
- lifting products maintained by LEIA members: LEIA’s own published figure.
The rates per 100,000 people are our own calculation from the official counts and population figures. We will update these lift statistics when new figures are published, so check back each year.
Download the data: every figure in this guide, with its source, as a CSV file. You are welcome to reuse it under the CC BY 4.0 licence; please credit Future Lift Services and link to this page.
Talk to us about your lift
If your lift traps people, breaks down often or hasn’t been serviced for a while, we can help. We offer a free lift survey and quote: call 01708 986845 (08:00 to 17:00, Monday to Friday) and we will look at your lift, explain what we find and suggest a maintenance plan to suit it.
Questions people ask
How many people get stuck in lifts each year in the UK?
Fire crews in England attended 13,769 lift releases in the year to March 2026, about 38 a day. The real number is higher, because many people are freed by lift engineers without the fire service being called.
How often do lifts break down?
There is no national figure for all lifts. Passenger lifts at Network Rail stations had about seven faults each in 2025/26, and 59% were down to wear and tear.
How many lifts are there in the UK?
There is no official count. Members of LEIA, the lift industry’s trade body, maintain over 300,000 lifts, escalators and other lifting products.
Are lifts safe?
Yes. In 2025/26, 21 people needed hospital treatment across 13,769 fire crew lift rescues in England, and there is no official UK figure for deaths caused by lifts.
How can I stop people getting stuck in my building’s lift?
Have it serviced regularly, every two months for most passenger lifts, and report door problems straight away. Door faults are the most common cause of trap-ins on the lifts we look after.